Data were obtained primarily from The COVID Tracking Project by The Atlantic (CC BY-NC-4.0): covidtracking.com. Per capita adjustments were made based on 2018 state population estimates from the Census Bureau, downloaded through Social Explorer.
A discussion of the methodological approach underlying the estimates on this site can be found in this pre-print: https://doi.org/10.1101/2020.06.26.20141135. All code and data used to produce the estimates on this site can be found at the following repository: https://github.com/favero-nate/covid-underreporting.
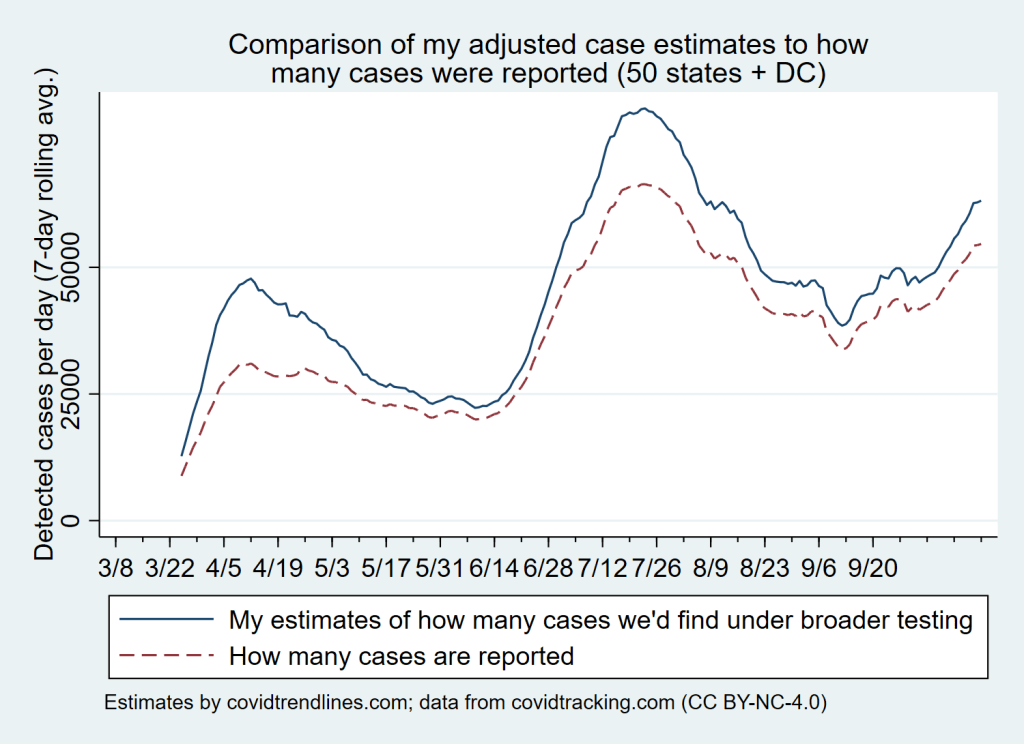
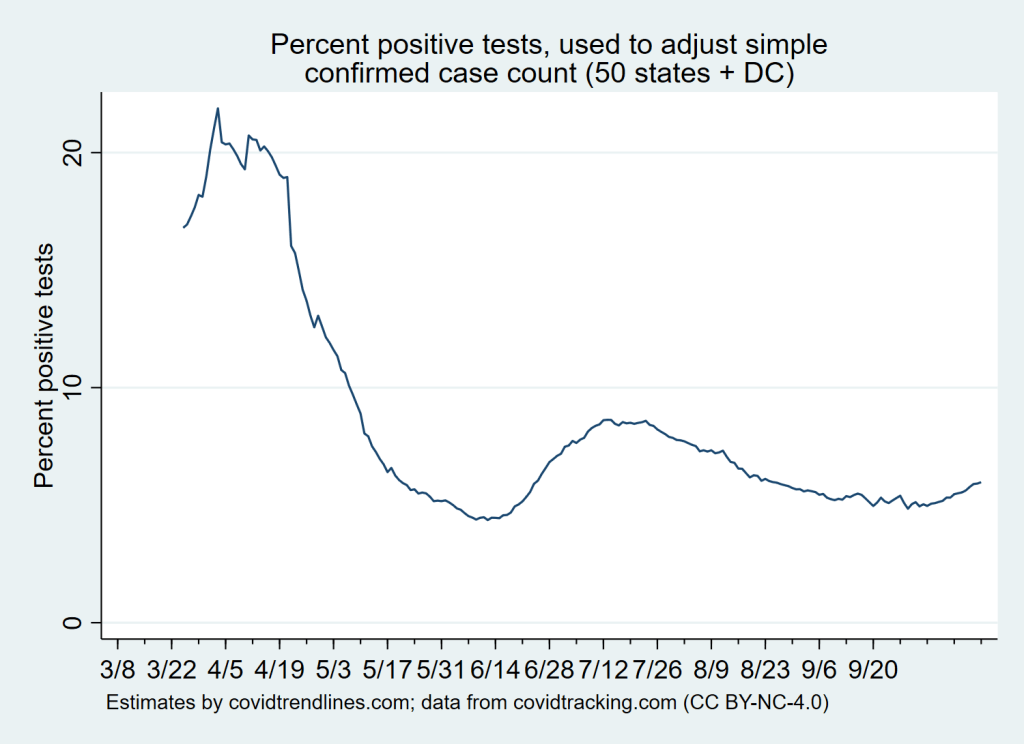
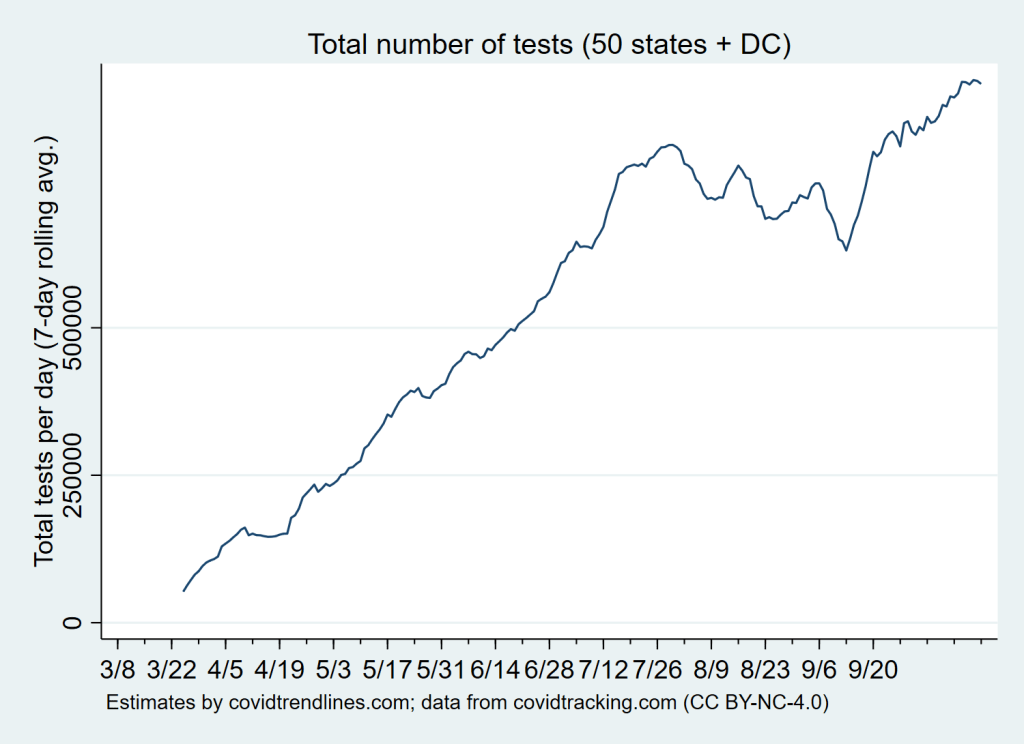
The basic approach used here is to create a 7-day rolling average of reported coronavirus test result counts (for both positive and negative test results). The number of newly-confirmed cases is then adjusted based on the percentage of test results that come back positive according to the following formula: adjusted_new_cases = new_cases*(1+.026213*percent_positive). This adjustment was calibrated based on a regression model using newly-confirmed cases and the percent positive among new tests to predict excess deaths attributable to COVID-19, pneumonia, or influenza (COVID-19 may be somewhat frequently misdiagnosed as pneumonia or influenza when coronavirus testing volume is inadequate).
A rough interpretation of the numerical estimates provided on this site is that they estimate how many new cases would be confirmed each day per 100,000 people if the state was doing enough testing that very few tested specimens were coming back positive. In practice, this interpretation is a bit risky because it relies on extrapolating beyond the testing volume we actually observe within our sample.